Dashboards
Dashboards are a set of visualizations which enable us to deeply understand our data through an efficient, creative and interactive way. Personally, I enjoy doing, designing and creating dashboard because it is a way to tell a story using available raw information. Dashboards are the main resource and tool related with the concept of Business Intelligence or just BI. This concept encompasses a set of technology-driven strategies and processes for analyzing data and delivering actionable information that contributes to the executives, managers and workers to make well informed business decisions (Stedman, 2020).
Particularly, I am used to work with Power BI software, which is a tool provided by Microsoft, in order to deploy my creativity into a dashboard. This program allows me to design amazing visualizations, create useful metrics and KPI’s through its language called DAX, share the main insight easily and deal with huge relational databases as well.
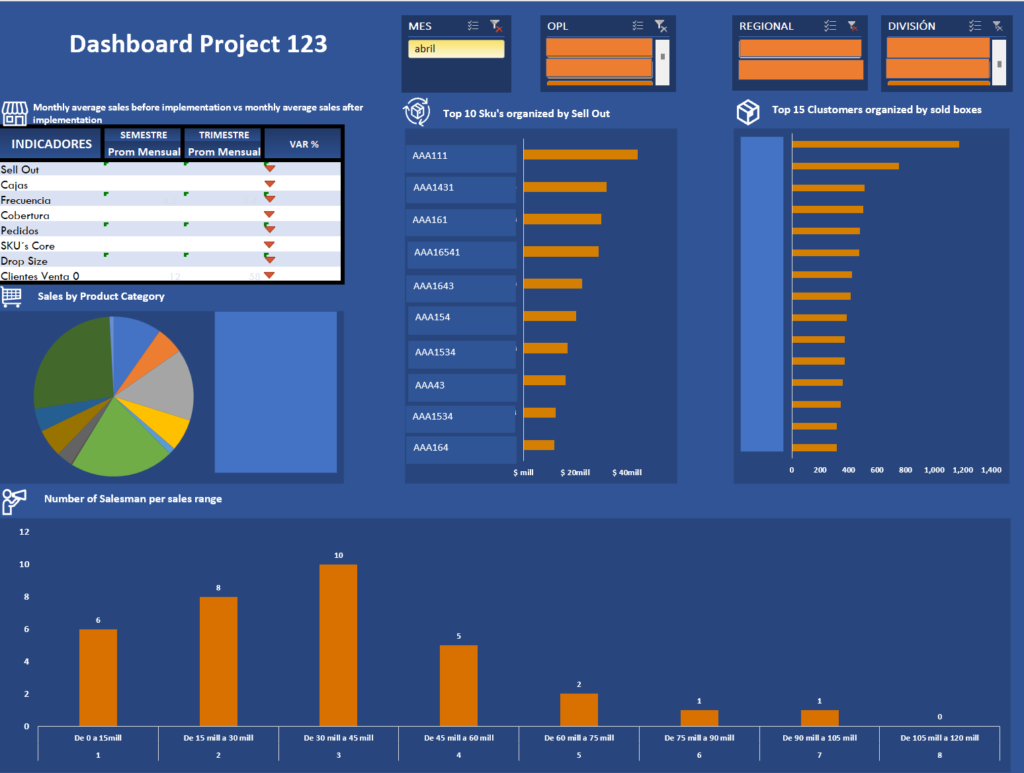
In this post I attached some examples of dashboard made by me in order to show my BI skills. Some of them have been done through Excel and its complement Power Pivot which works quite similar to Power BI.
Dashboard sample # 1: Sales report – link
Dashboard sample # 2: Sales 96-98 – link