Text mining – Part II
Continuing with text mining projects, now, we are going to execute code, in R as well, in order to get relevant qualitative and quantitative insights extracted from a random WhatsApp group chat. Following marketing purposes this project could be really useful in order to understand deeper and more objectively the perception of customer or potential customer in regards of the product or services provided by a company and given that WhatsApp has positioned itself as one of the main communication channels, the code developed along this project could be really helpful for marketing teams.
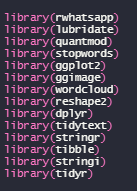
As always, the beginning of each project starts with the required libraries, in this case the libraries are:
Second it is necessary to clean the data in order to:
• Get rid of empty data
• Make sure that the data is using the correct format
• Unnest columns and assign and ID to each message sent in the group.
• Eliminate useless words (stopwords) and undesired character such as numbers or punctuation contained in the messages. These characters and words are not relevant because will not indicate something related with the desires or emotions of the participants.
After the data has been cleaned, we can start making graphs and visualizations in order to understand better the data behind the WhatsApp group chat.
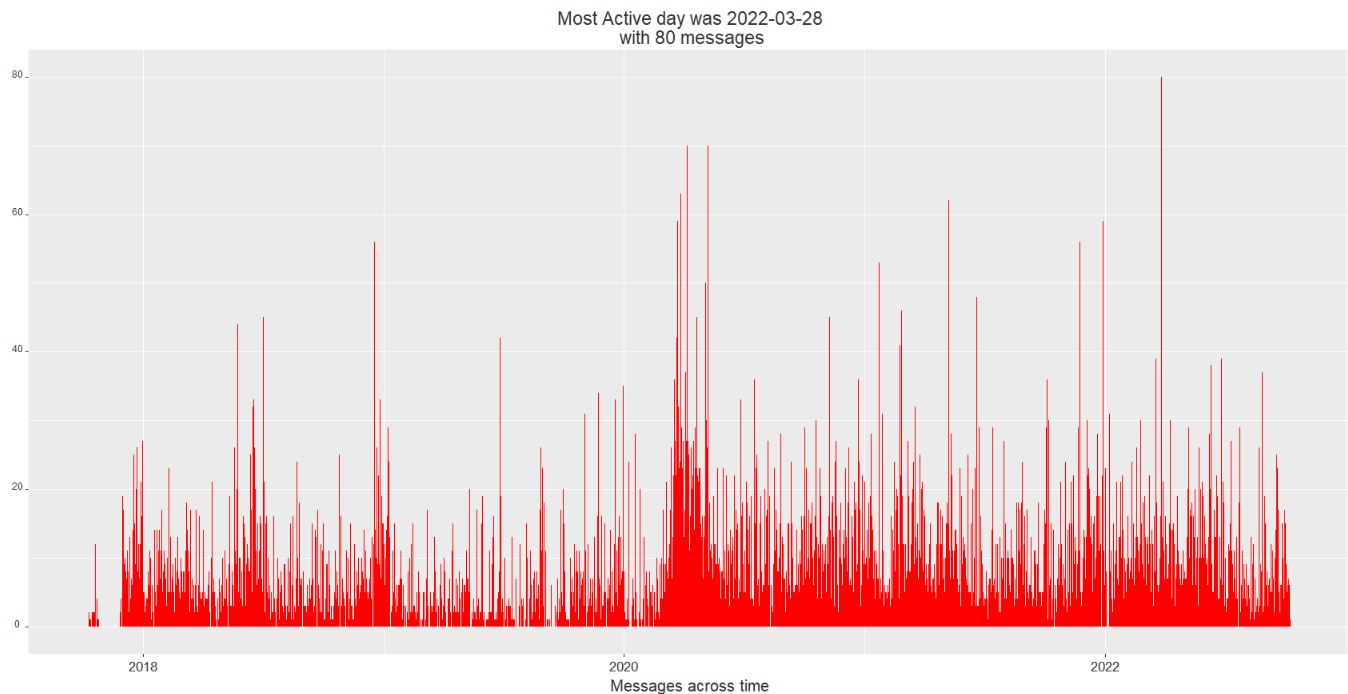
First a bar chart is made in order to show the number of messages sent in the group along the time period of the data which is approximately of 5 years. As a first glance we can see that the day with the highest number of messages was on march 28th of this year therefore it is possible to conclude that a special event took place within the context of the group chat on this day.
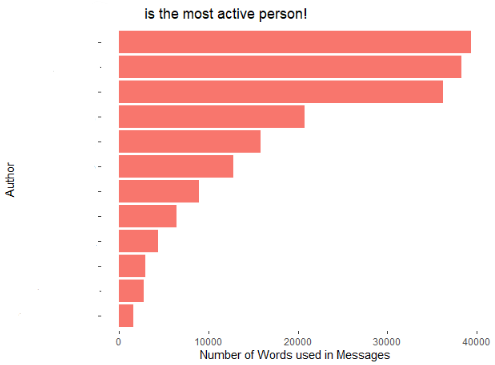
Then, a graph will be created with the total amount of words used in the group with this we can identify who is the most active user not by the number of messages but by the number of words. The following graph shows that information:
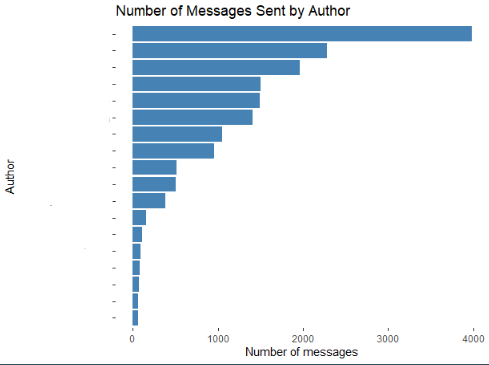
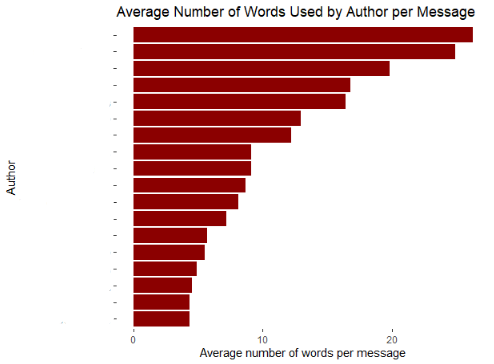
As an addition, in order to complement the graph, set above, we can create two other charts in order to show the most active user by number of messages sent along the time frame and also, we can organize the users by the average amount of words or characters used on each message. The two visualizations described above are the following:
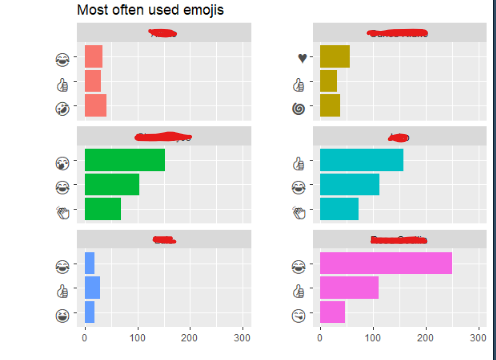
Given that in the WhatsApp group chat a lot of emojis are use, it is possible to develop chart in order to see which are the most used emojis within the chat by the most active users. The chart depicted below contains that information.
The initial base contains the time and date when each message was sent, the three following charts contains the information summarized by hour, day of the week and month of the year. With this information we can see at what time the highest number of messages are sent, what day of the week is the most active for the group and which is the month when the group chat activity is the most intense as well.
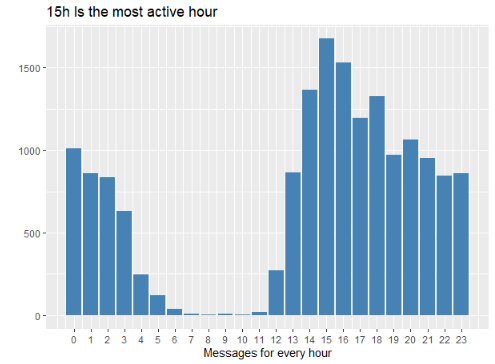
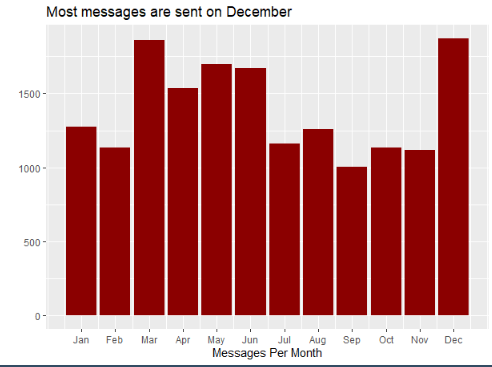
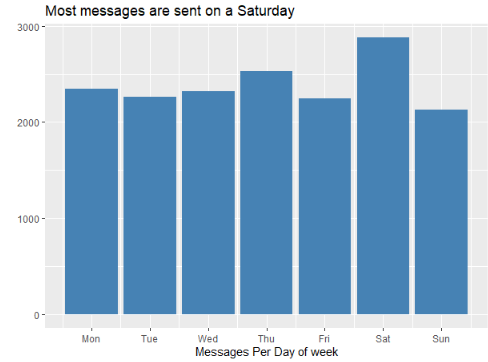
These three charts based on time are really useful in order to understand the activity patterns that rule the group chat. In a marketing context this could be fundamental because it gives s the insights about how the users interact with this specific platform, this could be quite important if we are looking to spread a marketing campaign and make it viral.
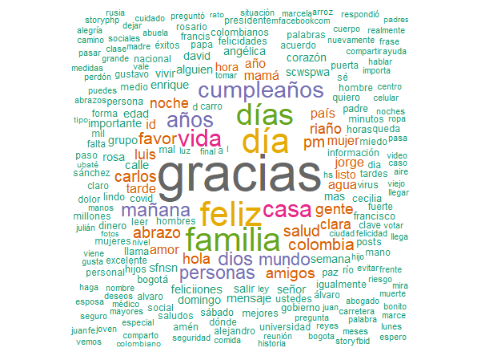
Finally, the last visualization is a word cloud with the most frequent words used in the group chat. The word cloud is really useful because it helps us to comprehend the main keyword related to an audience.