
Francisco Riaño
Text Mining Part I - Twitter API
- Francisco Riano
- No Comments
Text mining
The code could be found at: https://github.com/FranciscoRiano/text_mining_r
In this post, we will see what text mining is and how it could be developed in two projects based on Twitter API and in a WhatsApp group chat.
Text mining is the process which allows us to transform unstructured raw text into a structured dataset in order to identify meaningful patterns and relevant insights (IBM Cloud Education, 2020). Text mining uses natural language processing (NLP) which allows the machines to understand the human language and process it automatically (Monkey Learn, 2022) .
As it was stated above, in this post, it is going to be described how text mining could be applied in two different contexts; the first, using the Twitter API to get the sentiment analysis based on a specific hashtag; the second applied on WhatsApp in order to transform the daily qualitative data, produced withing a regular WhatsApp group, into quantitative insights. Both projects were done in R with their correspondents libraries.
The Twitter project was done in order to explore the sentiment of the users behind a specific hashtag. The chosen hashtag was # ukrainewar. It was chosen because it is a worldwide topic that, unfortunately, has a huge impact in the current times. Besides that, it generates a lot of controversy; therefore, could be interesting to use it in order to perform a sentiment analysis.
In order to start; first, it is necessary to list the required libraries used to download, clean and process the data. The following libraries are required:
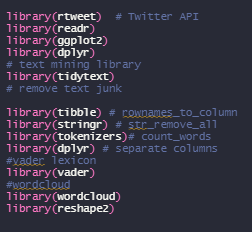
Once the libraries have been installed and/or activated we need to download the data from the Twitter API.
The used code will bring up to 5000 tweets (it is the maxim number of tweets given that we are using the free version of the twitter API), without replies neither retweets and just in English language.
After the dataset has been downloaded, we need to clean the raw data in order to eliminate undesirable characters (html stuff, links, numbers, excess of withe space etc.) Also, it is important to assign and ID to each tweet in order to organize and identify our data better.
Once the dataset has been cleaned, we can start to create visualizations in order to understand better our data. First, a histogram was created based on the number of characters in the tweets gathered in the dataset. Below the created graph
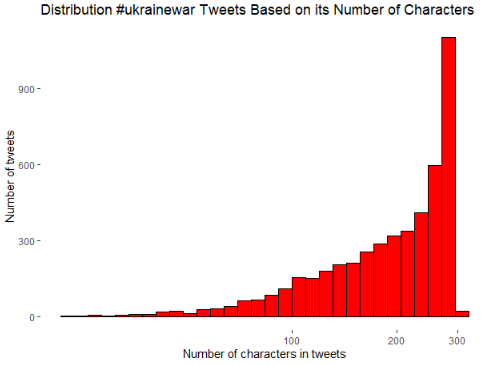
As we can see, almost all the tweets written, using the #ukrainewar hashtag, contains an amount of characters quite close to the number of characters constrain imposed by Twitter (280 characters)
Now that the first graph has been created, we can keep processing our data in order to create a new dataset which will just contain the ID of the tweet and a new column called “text” that will contain, on each row, just one word of each tweet; e.g., if a tweet contains 200 words, previously it was contained in just one row, with this transformation the content of it, will be split in 200 rows, one of each with one of the words that belongs to that tweet. Additionally, with the new dataset, we need to get rid of words that are not relevant enough (“and”, “to”, “for”, “from” etc.) these kinds of words are called stop words. To eliminate these words, we can use a standarized list provided by of the packages o R and/or we can just create our own list of stop words.
Given that our data is even cleaner, we can keep creating visualizations to comprehend, with more accuracy, messages behind our data. A graph is going to be created with the top 10 words mentioned in our dataset related with the #ukrainewar hashtag.
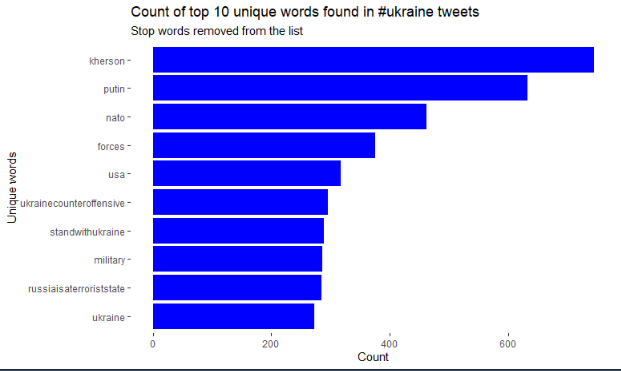
As a first insight, we can see how people, in general, supports Ukraine in this conflict. It is also interesting to see how people tend to relate different countries our organization such as USA or NATO to the conflict.
We can deploy, as a complement, a word cloud in order to see the most used words depicted through a different and creative wat. The size determines the frequency of which the word was used and the color its sentiment. The red words are the negative ones while the green are the positive ones.
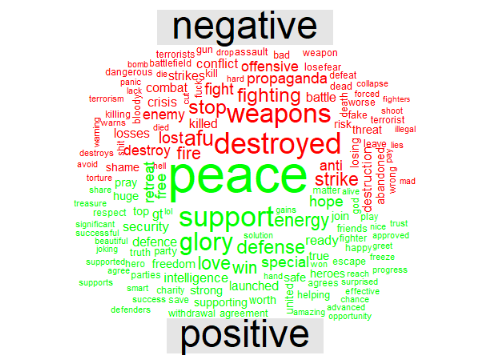
As a second insight we can see how, although persons support Ukraine, they also tend to request peace given that it is the most used word.
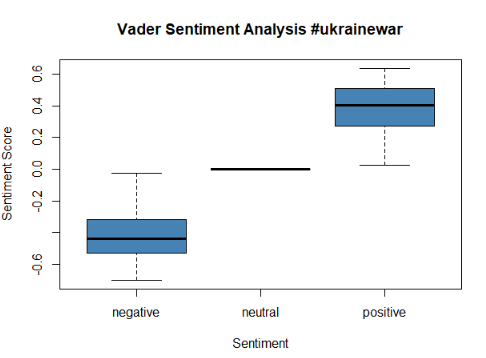
Following our intentions to perform a text sentiment analysis, the next tool which will be used is called VADER. VADER stands for (Valence Aware Dictionary for Sentiment Reasoning) and is a model used to get text sentiment because it is sensitive to both, polarity and intensity of emotions (Beri, 2020). It is important to recall that VADER gives a “score” to each word based on its emotion and intensity. With it we can transform qualitative information into quantitative data in order to measure sentiments behind the tweets.

The above picture gives us a summary of VADER in our dataset. As a first glance we can highlight several things: first; negative words are more in amount and in intensity than positive words, which is quite understandable given the context of the hashtag; second; neutral words are approximately 85% of the words in the dataset, it means that VADER either considered that the word was neutral or was not able to find a emotion linked with that word; third; on average negative words have a stronger emotion than the positive ones, while the score mean for the negative words was -0.420 the average for the positive ones was 0.385.
More visualizations are done:
Finally, after other processes were carried out in order to deal better with the data, a bar chart was done with the most used words, just as the second graph done, but on this occasion neutral words were excluded.
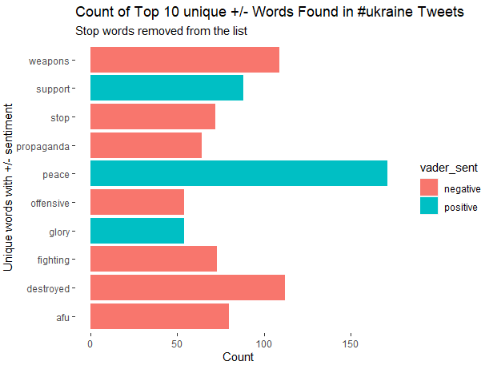
In this graph we can confirm how, although 7 of the 10 most used not neutral words are negative, the most used word by far is peace which clearly confirms the sentiment and desires of Tweeter users towards the war.
Additionally, one last graph was done in order to compare the sentiment scores for both kinds of words, positive and negative.
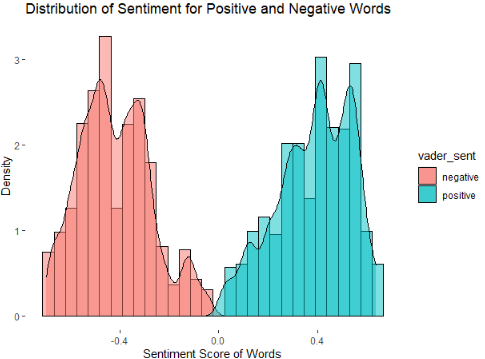
With this project, it was aimed to show the perception and sentiment, of a small sample size, of Twitter users towards one of the events that concerns the whole world the most. Although most of the comments and words related with the #ukrainewar hastag were negative, the most popular word was peace which confirms the desire of the users regarding this conflict.
References
Beri, A. (2020, May 27). SENTIMENTAL ANALYSIS USING VADER. Retrieved from Medium: https://towardsdatascience.com/sentimental-analysis-using-vader-a3415fef7664
IBM Cloud Education. (2020, November 16). Text Mining. Retrieved from IBM: https://www.ibm.com/cloud/learn/text-mining
Monkey Learn. (2022, October 07). What Is Text Mining? A Beginner’s Guide. Retrieved from MonkeyLearn: https://monkeylearn.com/text-mining/